
High frequency data is the solution to navigating a volatile environment
Warehouses are full of unneeded inventory due to the fact companies like Target and Walmart could not predict demand and production capability effectively. While few companies have come out with a supply chain success story from the past two years, there are lessons to be learned from the gross failure of demand side forecasts.
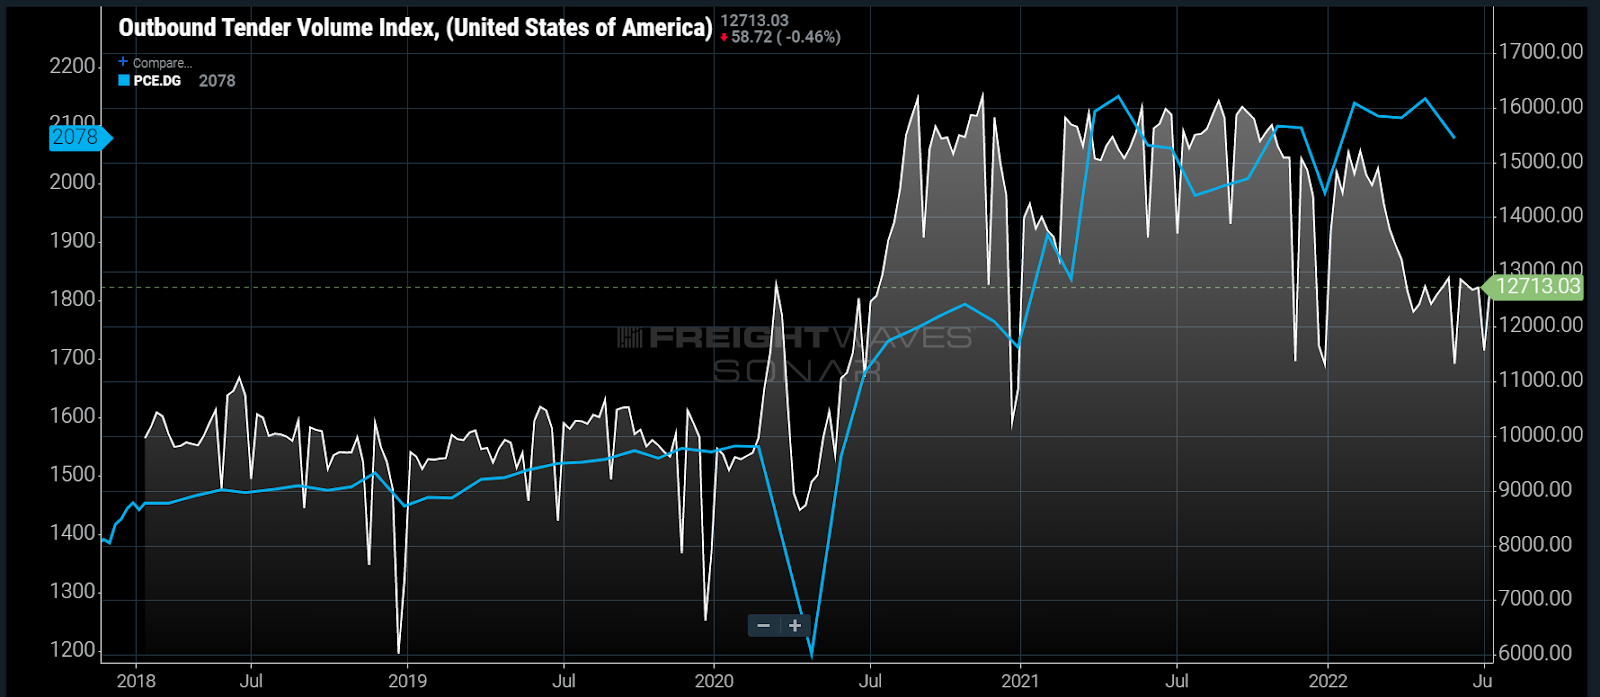
The Outbound Tender Volume Index (OTVI) that measures truckload demand did not predict the consumer shopping spree that defined the past two years, but it was quick to recognize it. The OTVI is currently showing a downward trend while consumer expenditures data shows a more stable pattern.
Many sales forecasts are based on macroeconomic data like personal consumption expenditures mixed with internal figures. Supply chain managers have been lulled to sleep by a relatively predictable environment and will need to change their forecasting methodologies moving forward.
All forecasts are not only based on historical data, but historical relationships. At the heart of every demand side forecast model is a data point that leads purchasing behavior. Many of those forecasts failed during the first onset of the COVID pandemic in 2020 because the relationships between variables broke down.
Data models are like complex machines. Data points are the gears in the machines. These machines have been built for a relatively stable environment with low levels of flexibility, mainly because they worked well enough for several years.
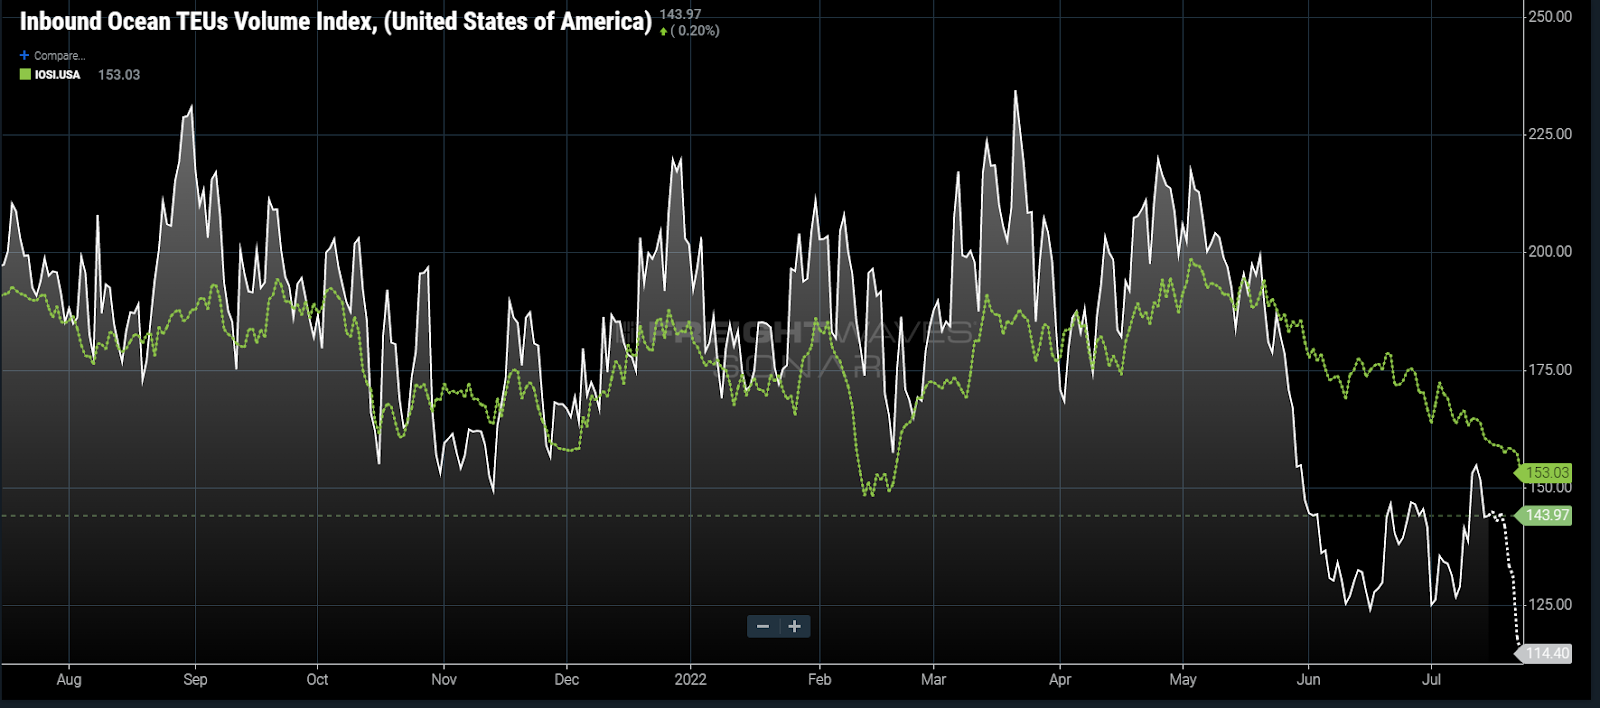
Chart of the Week: Outbound Tender Volume Index – USA, Personal Consumption Expenditures – Durable Goods SONAR: OTVI.USA, PCE.DG
Supply chain managers are already adopting more flexible ordering strategies as they place smaller orders with less shipping lead time for imports. Shippers are giving carriers 9.6 days’ notice compared to 12 in late April, while shipments are averaging 16% fewer TEUs per shipment. They will also have to change their forecasts to become more flexible and reactive.
Two years after the onset of COVID, society is still in a transitory state with a fairly unique environment. It is natural to try to predict the future with the past, but few models accurately describe the present due to the lack of near-term data. The pandemic has made the data prior to 2020 less applicable and the present more relevant.
Forecasting is a necessary function of any business, but old models have to be changed to not only adapt to the new environmental changes, but also to incorporate directional shifts more rapidly. To do this, the models need to incorporate data sets with the following traits:
- Fast/high frequency — data that comes in faster than a month.
- Simple — data that measures a single item and not multiple.
- Objective — data that is not heavily influenced by human emotion.
- Emotional — data that has an emotional aspect.
Fast data solves the volatility problem, giving you earlier warning that your forecast needs to change. Simple data allows you to have a faster and cleaner understanding of what is changing in the environment. Objective data is largely operational and has a wide sampling of sources, measuring action over perception. Emotion is part of any market and has to be accounted for.
Mixing these together gives you a base case expectation with stronger flexibility to navigate economic ups and downs. Weights of the data can be changed based on the expectations or risk assessment.
Before the pandemic, most forecasts were based on seasonal expectations with some inflationary pressure. Data sets with long histories like several macroeconomic indicators may be comfortable to work with, but they are generally slow and many are measured in currency or seasonally adjusted. None of them are fast or reported frequently enough to provide the flexibility necessary to navigate the coming months.
About the Chart of the Week
The FreightWaves Chart of the Week is a chart selection from SONAR that provides an interesting data point to describe the state of the freight markets. A chart is chosen from thousands of potential charts on SONAR to help participants visualize the freight market in real time. Each week a Market Expert will post a chart, along with commentary, live on the front page. After that, the Chart of the Week will be archived on FreightWaves.com for future reference.
SONAR aggregates data from hundreds of sources, presenting the data in charts and maps and providing commentary on what freight market experts want to know about the industry in real time.
The FreightWaves data science and product teams are releasing new datasets each week and enhancing the client experience.
To request a SONAR demo, click here.